http-inspector — a DevTools Network tab for Node.js process
When you develop a Node.js application which acts not only as a server, but as a client to any external API, you will eventually come up with a need for HTTP requests visualization.
In the frontend world there is a great tool for that. It’s a built-in feature of most modern browsers. For example, in Google Chrome it is called DevTools. It allows you to view DOM elements tree, see all HTTP requests, profile your application, debug scripts and so on.
When I was working on some of my Node.js projects, I was often missing good old DevTools as a network requests tracing tool, so I decided to create it.
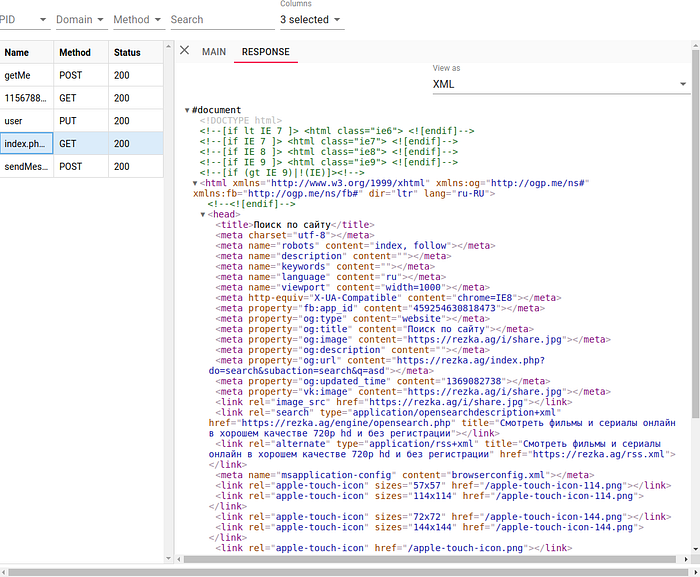
My solution is called “HTTP Inspector” and it consists of two NPM modules: http-inspector (GitHub corporateanon/node-http-inspector) and http-inspector-ui (GitHub corporateanon/node-http-inspector-ui). The fist one is an agent, which intercepts all outgoing HTTP requests by patching Node.js internal ‘http’ and ‘https’ modules. The second one is a web interface which visualizes HTTP requests captured by ‘http-inspector’ in an easy-to-read table.
How it works
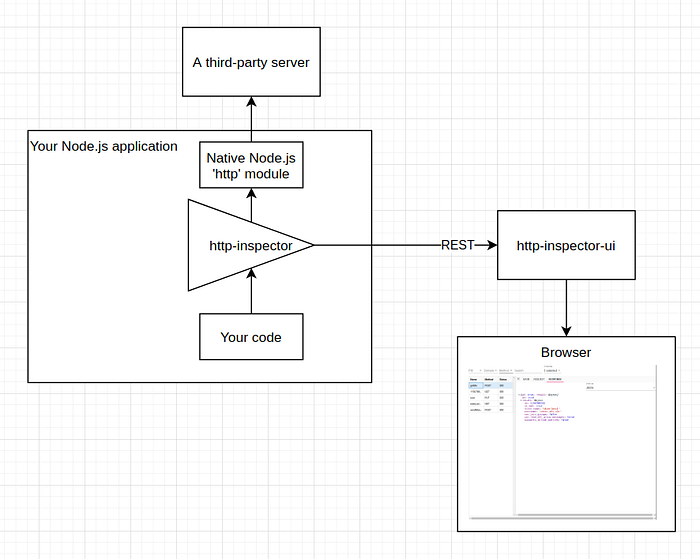
It is easy. ‘http-inspector’ replaces two methods ‘http.get’ and ‘http.request’ with own implementation, which collects a request data and sends it to ‘http-inspector-ui’ API. And, of course, it calls native ‘http.get’ and ‘http.request’ methods respectively.
On its turn, the ‘http-inspector-ui’ is a RESTful server, which listens to what ‘http-inspector’ instances send to it, and renders it in your browser.
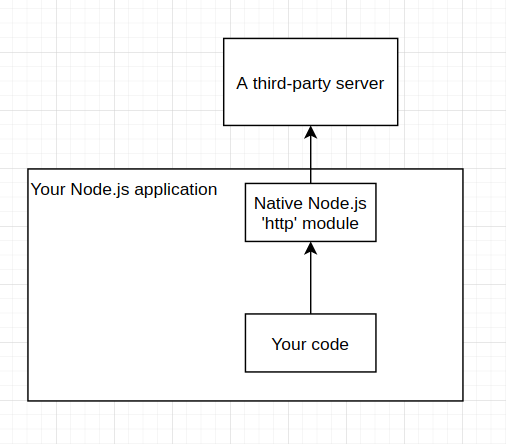
Normally your Node.js application consists of your code which calls ‘http’ module which makes HTTP requests to some third-party server in order to get or update some information on it.

When enabled, ‘http-inspector’ brings a ‘spy’ between your code and ‘http’ module. And this spy duplicates every request your code makes, sending it to ‘http-inspector-ui’ server.

Getting started
In order to start tracing your requests with http-inspector, you have to take the following steps:
- Install ‘http-inspector-ui’ globally:
npm i -g http-inspector-ui- Install ‘http-inspector’ as a development dependency in your project:
npm i -d http-inspector- Add
require('http-inspector/inject')in your server script in order make it able to intercept all requests - Enable tracing with setting an
HTTP_INSPECTORenvironment variable toui - Run
http-inspector-uiin your terminal. A default browser will be opened at http://localhost:4380/
In production, of course, you should not enable ‘http-inspector’, so you don’t have to set HTTP-INSPECTOR variable.
Features
Detailed request view

You can view all request and response headers along with a process information and CURL command to reproduce a request in a terminal.
Request/Response content view


You can easily view text, JSON, XML, HTML, form-urlencoded or image data in Request and Response tabs.
Mobile devices and dark theme support

Further plans
In future I am planning to add the following features:
- React Native support. It would be nice to bring a network tracing tool to mobile development.
- HAR export. HAR (or HTTP Archive) has become a de-facto standard for HTTP requests tracking tools. It would be possible, for example, to view data, gathered by ‘http-inspector’ in Chrome DevTools which supports HAR import.
- Visual Studio Code plugin. Integrated into an IDE, ‘HTTP Inspector’ would be provide more consistent experience for developers.
Subscribe to my Medium blog, star http-inspector and http-inspector-ui on GitHub in order to stay tuned for the updates.
